

Baseball is a game of numbers. Everything is about statistics and acronyms. HR, WHIP, AB, RBI, OPS, OPS+, DER, WAP, oWAR, K/BB. It’s easy to get lost in the stats and become confused about which statistics you should be paying attention. Of course each analyst is different, and may take different statistics and information into consideration when evaluating players and teams. But what are the best statistics to pay attention to?
When talking about batters, home runs are obviously the most exciting statistic to follow, both in the scorebox and at the stadium. Who doesn’t want to see Aaron Judge knock another one out of the park? But following that one statistic isn’t a great measure of a player’s worth and abilities. A lot of people resort to looking at batting averages and runs batted in. But again, these still aren’t a good way to evaluate players, they leave out batters who are walked (intentionally or unintentionally), don’t take into account how many 2B, 3B or home runs they’ve hit and are stats that aren’t individual to one player, but rely on teammates pitching in.
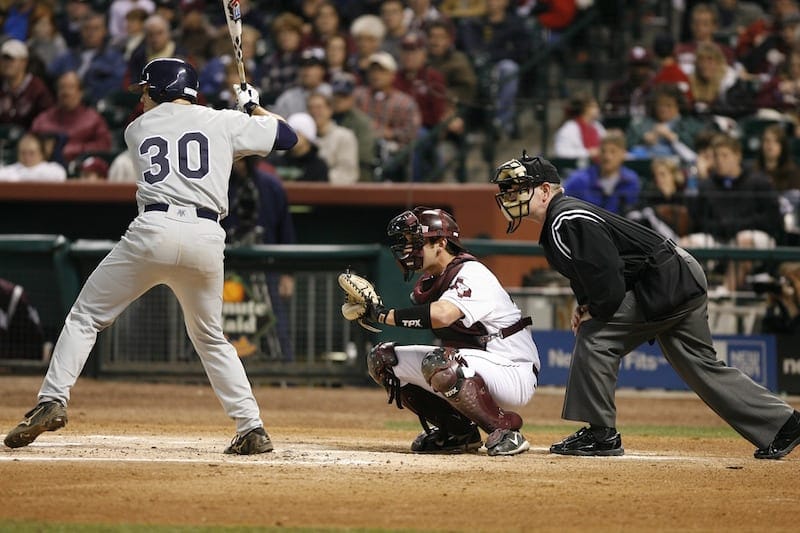
Instead, fans should be checking out the on base percentage (OBP), or, per MLB.com, “how frequently a batter reaches base per plate appearance.” This includes all hits, walks and being hit by a pitch but leaves out fielder’s choice and errors. The OBP is a good measure of how many times a player doesn’t make an out. You’ll usually find players with OBP batting towards the top of the order, to try and get on base early and give their teammates the opportunity to drive home runs. The formula for measuring OBP is:
OBP = (Hits + Walks + Hit by Pitch) / (At Bats + Walks + Hit by Pitch + Sacrifice Flies)
Perhaps an even better statistic to use to evaluate a player is their on-base percentage plus slugging percentage, OPS+, and comparing it to other players while taking ballparks and the season into consideration. When you look at a player’s OPS+ you are looking at how productive a player is by putting him side by side with other great offensive players, if he is above the 100 average, he’s doing well. If he’s below, he needs to put in some work.
As for defense, the best way to check in on how your team is doing defensively is their the defensive efficiency rating (DER), the percent of balls put into play that a team converts into outs. How does it work? As the Society of for American Baseball Research explains, “a team that records outs on 72 of 100 balls put into play has a DER of .720.” Pretty easy to calculate right?
The other way to judge your favorite player’s defensive work? The good ol’ fashioned eyeball test. If you watch the game, it’s evident who’s putting in the most effort and turning heads with incredible plays without making errors along the way.
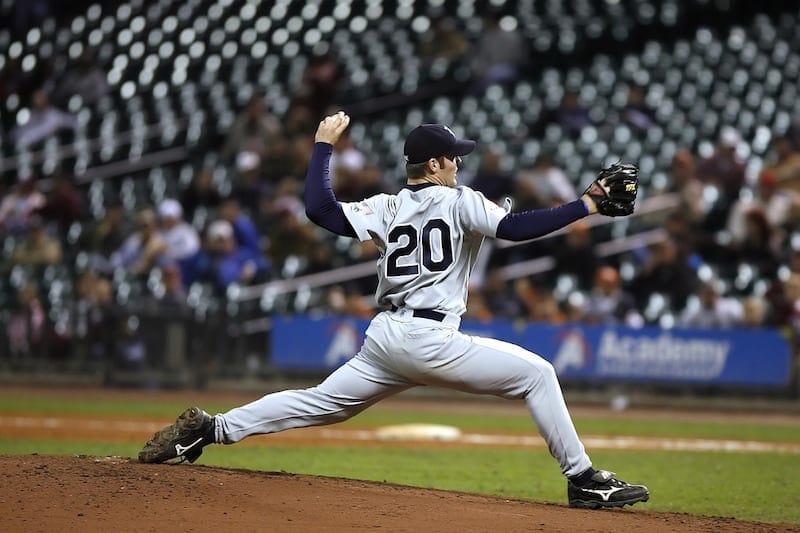
Now how do you judge the guy on the mound? Is it his win-loss record? His ERA? Perhaps how many batters he strikes out per game. The latter is one of the most exciting things to watch as a fan. Who doesn’t enjoy watching King Felix KO 12 guys per game? Unfortunately, as great as they are on a scoresheet, strikeouts aren’t a great measure of a pitcher. Instead, it’s best to look at their WHIP – Walks and Hits per Innings Pitched. It’s easy to calculate, simply walks + hits/ innings pitched, and a great measure of how many baserunners a pitcher has allowed (not including errors).
Baseball stats can be a confusing thing, but when you know where to look, the bigger picture becomes much clearer. You can’t judge a guy by his batting average or win-loss record, there’s a much more complicated story behind the numbers. You just need to know which acronym gives you the most information in a single statistic.


The greatest NBA dynasties of all time
The goal for any basketball franchise is to build a dynasty that fans and experts will be talking about for